This week we explored some different platforms for creating infographics. Infographics are essentially visual displays of information. Because they are visually interesting and use very little text, they are a great way to get students to both take in information and synthesize what they've learned into a concise, understandable format. This week I used the trusty app, Piktochart, to help me make my infographic.
Piktochart is a free app that can be purchased from the App store. It is a great resource, not only for infographics, but also for posters or digital media needs. Although I had used Piktochart once before, this was my first time creating an infographic. Overall, the app was very easy to use. I was able to search for icons I wanted, change the text / background color, and choose from a variety of fun templates to help me get started. Piktochart also provides a nice tutorial to begin with, helping users understand the ins and outs of the application. I could see Piktochart being a very useful infographic-building platform for students. As I mentioned previously, it helps students to think deeply about what are the most important pieces of information / what do I want to convey to my audience, and what is the best way I can display it visually? It would be a great way to incorporate STEM with the arts, as it can serve as a creative presentation format for research findings. There are also limitations, of course. Because there are so many options, it could take a lot of time for students. The teacher would definitely want to set clear boundaries for how elaborate the project should be and how much time students can have to work on it in class. Still, I think students would be a great way to engage students. Check out the infographic I assembled using this app below. I also created a Pinterest board with some great examples. 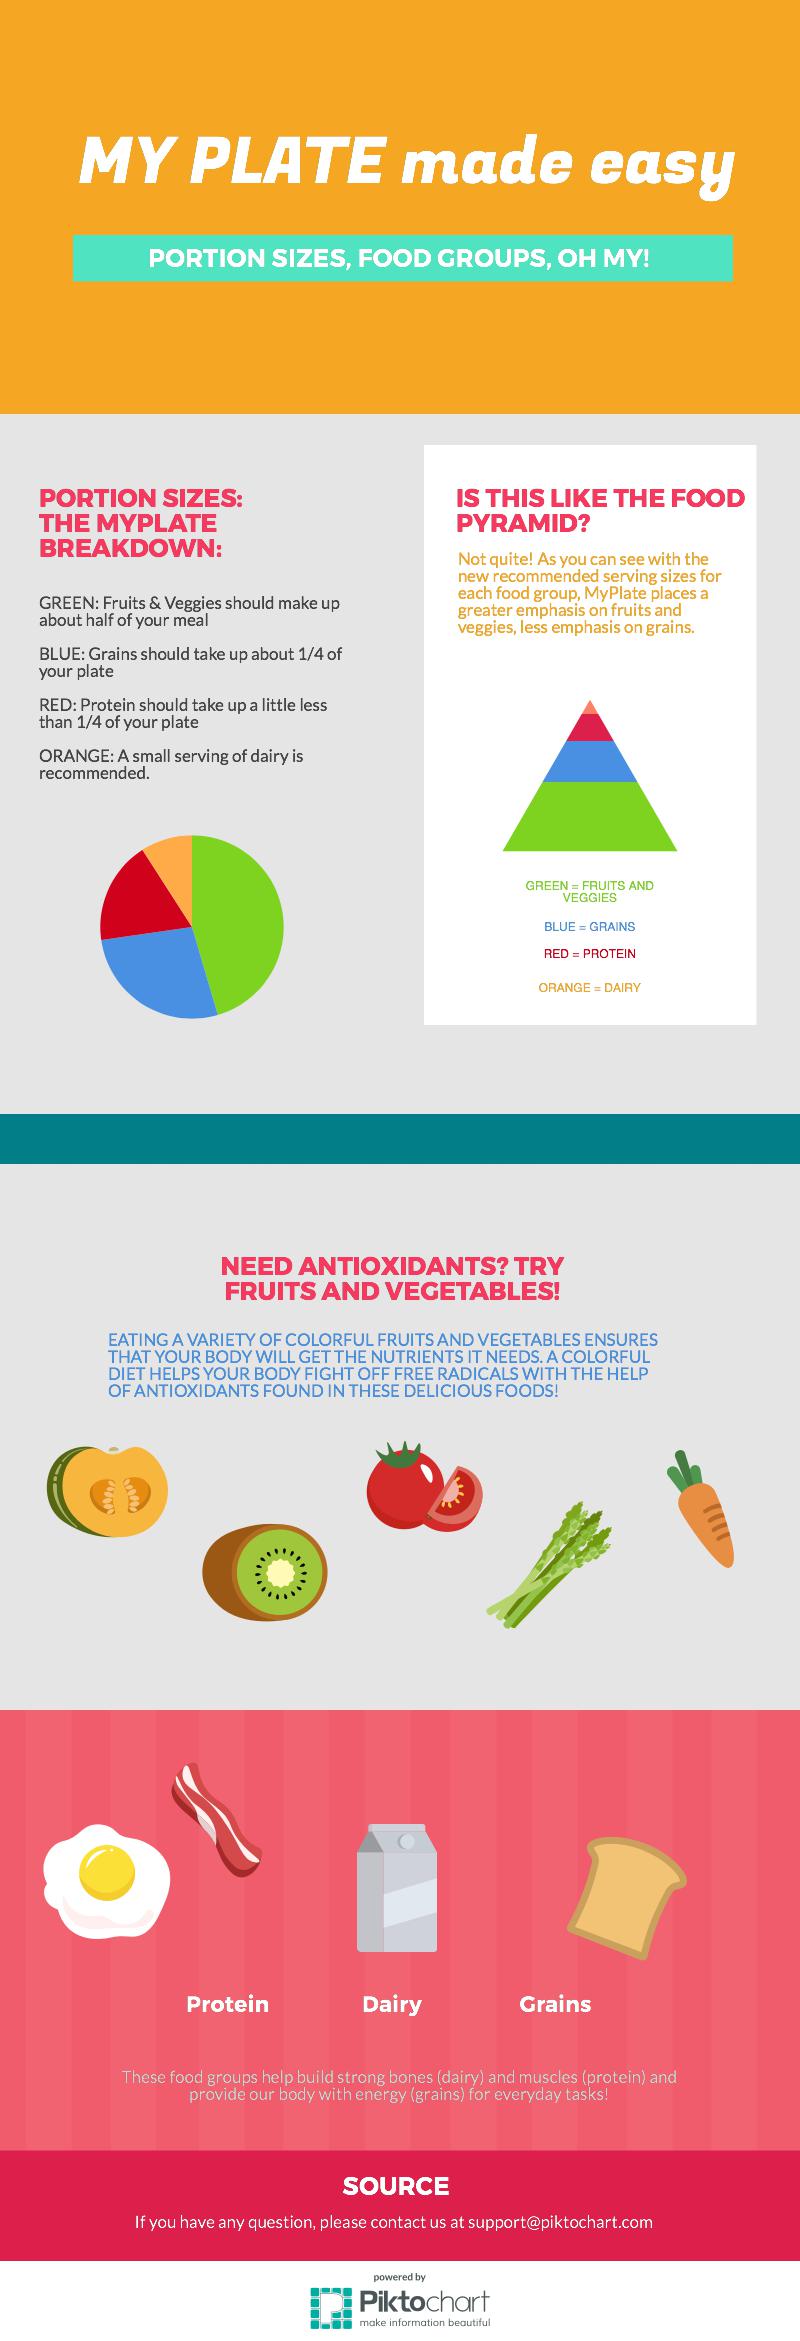
Here's a tutorial on creating infographics with Piktochart:
0 Comments
|
AuthorFind me on social media: ArchivesCategories |
 RSS Feed
